Evaluating QBs: Why Not Wins?

Full disclosure: I’m a Peyton Manning fan. If you can’t get past that, stop reading now. Still there? Good, welcome.

Following the Broncos recent loss to the Ravens (and the subsequent Patriots loss), there has been a new wave of the old Manning vs. Brady argument. Clutch vs. choke. Winner vs. can’t-win-the-big-one. Add in another playoff loss for Matt Ryan and a couple big wins for Joe Flacco, and the debate is raging like never before.

If you’re reading this, you’ve probably at least touched on the subject this January. I have. The debate always seems to deteriorate into emotional arguments filled with snarky retorts and anecdotal “evidence”. Tuck Rule game is countered with the Helmet Catch. The Flacco Prayer is answered with the Tracy Porter pick six. And on and on. And on. Every quarterback has been lucky, and every quarterback has been unlucky. Everyone can bring up some argument to support their claim. Without looking at the entire picture, we’ll never reach a valid conclusion. There has to be a better way.

A Clean Slate Continue reading

Posted in descriptive, Evaluating QBs Series, Football, offense versus defense, player evaluation, predictive, talent distribution, team evaluation | Tagged , , , | Leave a comment

An Improved Look at Pre-season Strength of Schedule

As we gear up for another NFL season kicking off in just over a week, there will be lots of discussion of Super Bowl contenders and playoff predictions. Which teams will improve and which will decline. One of the big and often over-looked factors in these exercises is a team’s strength of schedule.
Often, when the schedule is released, you’ll see attempts at determining the most difficult schedules like this one that use the previous season’s records to determine the quality of the opponent for each game. While this is a reasonable starting point, it definitely has its flaws.

What’s wrong with traditional Strength of Schedule measures? Continue reading

Posted in Football, predictive, review, team evaluation | Tagged , | Leave a comment

The Achievement S-Curve: 3/10/2012

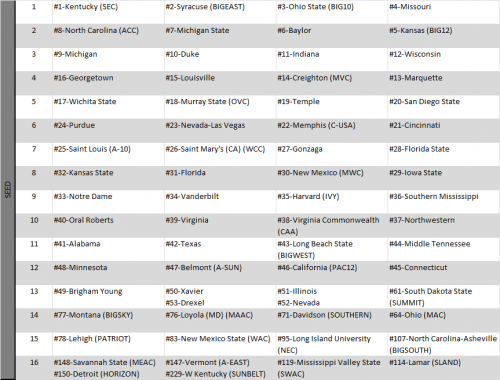
About half of the automatic bids are still up for grabs this weekend, but the NCAA Tournament picture is starting to take shape. It’s time for one last Achievement S-Curve update. As always, the full ratings can be found here. All data updated through Friday, March 9th. Click to view bigger.

Let’s take a look at some of the biggest discrepancies and see what we can learn. Continue reading

Posted in College Basketball, descriptive, March Madness, team evaluation | Tagged , , , | Leave a comment

The Blindness of the Blind Resume

I love the spirit of the blind resume. I hate the execution.

With Selection Sunday just hours away, you will undoubtedly be inundated with blind resumes comparing multiple teams and asked to decide which team is in and which is out, or which team should be seeded higher. I like the sentiment behind these: strip away the name of the team, their history, their media coverage, their conference affiliation and focus solely on what they’ve accomplished this season. The problem is that the blind resumes focus on the wrong information, making the comparisons flawed.

Why the Blind Resumes are Flawed

A typical blind resume looks something like this: Continue reading

Posted in College Basketball, descriptive, March Madness, team evaluation | Tagged , , | Leave a comment

What the RPI is and what it is not

Earlier today on CBSsports.com, Matt Norlander wrote an article about the much-maligned RPI. He comes to this conclusion:

If anything else, this chart proves there are far too frequent communication breakdowns with teams across the board, enough so that the RPI goes beyond outlier status and continues to prove what many have known for years: If the RPI was introduced in 2012, it’s hard to reason that it would be adopted as conventional by the NCAA or in mainstream discussion.

Norlander then provides the heart of his argument, a table comparing the RPI to various other basketball ratings: Sagarin (overall), KenPom, LRMC, Massey and BPI. He points out that “Texas, Belmont, Arizona and Southern Miss all have big disparity as well. The largest gaps are UCLA (62 points lower in the RPI) and Colorado State (65 points higher in the RPI).”

The RPI is a rating created to measure what a team has accomplished so far this season based on their record and their strength of schedule. It is a descriptive rating. LRMC, Massey, BPI, and Sagarin are predictive ratings at their core (though some are even worse, a random combination of descriptive and predictive). Comparing the RPI to these ratings and concluding that because it doesn’t match, it is flawed, is itself a terribly flawed argument. Of course it doesn’t match, it is trying to measure a completely different thing. I agree, the RPI is flawed, but not because of this.

Norlander’s article should have been about his preference for selecting and comparing teams based on their true strength instead of their resume, and not about the quality of the RPI which has little to do with this debate. Even if the RPI perfectly did it’s job (of measuring how much to reward teams for their performance on the season), it would have failed the test in this article. Let’s take a deeper look. Continue reading

Posted in College Basketball, descriptive, March Madness, predictive, review, team evaluation | Tagged , | Leave a comment

The Importance of Seeding

This post was a 2-part guest post at TeamRankings.com. Here are Part 1 and Part 2.

With a month left in the season, most of college basketball is focused on who’s in and out of the tournament. Those teams near the cut line are on the Bubble, while teams that are securely in the tournament are Locks with little worry of falling out of the bracket and seemingly little left to gain with their dance cards punched.

Turns out, there’s still plenty to play for, especially at the top. As every fan knows, the NCAA Tournament is seeded from 1 to 16 in four separate regions. The top seeds are rewarded by being placed at locations close to home, protected from a home-crowd disadvantage, and–most importantly–pitted against easier opponents. That last point is even more pronounced than one might expect. Obviously every team wants to move up a seed line, but the importance of climbing each rung of the seeding ladder might surprise. Continue reading

Posted in College Basketball, March Madness, predictive, talent distribution, team evaluation | Tagged , , | 2 Comments

The Selection Question Revisited

The Philadelphia Eagles finished the season 8-8, but outscored their opponents by 68 points, the 5th-best mark in the NFC. Seven of their 8 losses were by one score or less, and they finished the season hot on a 4-game winning streak. Most rankings that try to determine how strong a team truly is had the Eagles as high as the 4th or 10th or 7th best team in the entire NFL. The team was filled with talented players like Michael Vick, LeSean McCoy, and Nnamdi Asomugha, among others, and easily passed the “eye” test as a good team capable of beating anyone at their best. In addition, two of the team’s losses came with their star QB sidelined and a third loss came when star WR DeSean Jackson was benched. When it came time to select the NFC’s playoff teams, the committee decided that Philadelphia was definitely one of the 6 best teams, and left out the Atlanta Falcons despite their 10-6 record as well as seeding the Eagles ahead of the 9-7 Giants, the winners of the Eagles’ division.
**********

I get the feeling that if this were to happen, fans would be outraged. However, this is exactly the type of thing that happens every year in the NCAA Tournament selection process. Continue reading

Posted in College Basketball, descriptive, Football, March Madness, team evaluation | Tagged , , | Leave a comment

Quick Slant: Murray State punches ticket

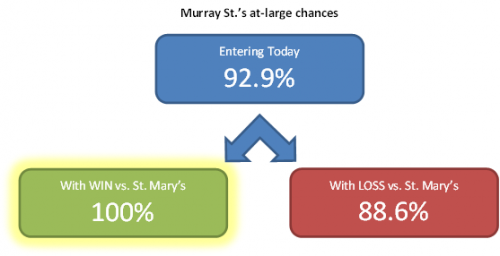
One cool thing we can do with the rest-of-season simulation is look at the effect that the outcome of a specific game can have. As an example, take today’s headline BracketBusters game between Murray State and St. Mary’s that just finished. Entering today, the Racers had a 92.9% chance to get an at-large bid should they fail to win their conference tournament. With a loss today, that would have dropped to 88.6%, but Murray State was able to pull out the big victory at home and–at least according to the Achievement S-Curve–punch their ticket to the Big Dance.

Posted in College Basketball, March Madness, Quick Slant, simulation, team evaluation | Tagged , , , | Leave a comment

The Achievement S-Curve: 2/13/2012

Quick update on the Achievement S-Curve.

First, the bracket and the full ASC data here:

The ASC is converging with Bracketology. Besides differences in doling out the automatic bids, just two of Lunardi’s at-large teams were not in my bracket–BYU and Arizona–and they were my very first two teams below the cut line. One of the two spots went to Nevada since I give the WAC auto bid to New Mexico St. The other went to Northwestern, who I have all the way up at a 9-seed. I think the Wildcats are not being given due credit for their tough schedule, which I have ranked 10th toughest. Since I touched on Northwestern last week, I’ll use another Big Ten team that I believe is underseeded as this week’s example: Illinois.

Bracketology has the Illini as a 12-seed while the ASC sees their resume as worthy of a 6-seed. For comparison’s sake, since I have already picked on Florida in the past, I’ll spare them and go after their in-state rival Florida St. (#11 in the ASC, #6 in Bracketology). I’m going to debut a new tool to help display a team’s schedule. These graphs show a team’s schedule from toughest game to easiest. Green bars show wins while red bars indicate losses. The gray bars represent the opposite score for that game should the outcome have been flipped. This allows us to see exactly how a team is arriving at its score.

Here are the graphs (no cool name yet, but I should come up with one) for Illinois (on top) and Florida St. on the bottom (try clicking twice to view them larger). Continue reading

Posted in College Basketball, descriptive, March Madness, predictive, team evaluation | Tagged , , | Leave a comment

Who’s REALLY Going Dancing?

Around this time of year, there’s lots of talk about who’s in and who’s out and who’s on the bubble. Plenty of chatter about what may or may not get your team into the Big Dance. Tons of discussion of big wins and bad losses.

I’ve spent the past few weeks posting my Achievement S-Curve, an objective, reward-based system of who should be in the tournament if the season ended today. But the season is not going to end today, despite how much Murray State may have wanted it to end before they took their first loss to Tennessee State tonight. It’s interesting and fun to play committee member and decide the fates of 345 college basketball teams more than a month before the actual brackets are released. But what we really should be interested in is what is going to happen the rest of season.

It’s cool to see that overachievers like Murray State and San Diego State have climbed into the top half of the bracket, but if we know they’re likely to come down to earth a little bit that’s much more insightful. Conversely, underachievers like Alabama or Saint Louis might be on the bubble right now but if they’re going to work there way off of it and into the bracket, we shouldn’t really care too much.

The Solution: Simulation Continue reading

Posted in College Basketball, descriptive, March Madness, predictive, simulation, team evaluation | Tagged , , | Leave a comment