 Earlier today on CBSsports.com, Matt Norlander wrote an article about the much-maligned RPI. He comes to this conclusion:
If anything else, this chart proves there are far too frequent communication breakdowns with teams across the board, enough so that the RPI goes beyond outlier status and continues to prove what many have known for years: If the RPI was introduced in 2012, it’s hard to reason that it would be adopted as conventional by the NCAA or in mainstream discussion.
Norlander then provides the heart of his argument, a table comparing the RPI to various other basketball ratings: Sagarin (overall), KenPom, LRMC, Massey and BPI. He points out that “Texas, Belmont, Arizona and Southern Miss all have big disparity as well. The largest gaps are UCLA (62 points lower in the RPI) and Colorado State (65 points higher in the RPI).”
The RPI is a rating created to measure what a team has accomplished so far this season based on their record and their strength of schedule. It is a descriptive rating. LRMC, Massey, BPI, and Sagarin are predictive ratings at their core (though some are even worse, a random combination of descriptive and predictive). Comparing the RPI to these ratings and concluding that because it doesn’t match, it is flawed, is itself a terribly flawed argument. Of course it doesn’t match, it is trying to measure a completely different thing. I agree, the RPI is flawed, but not because of this.
Norlander’s article should have been about his preference for selecting and comparing teams based on their true strength instead of their resume, and not about the quality of the RPI which has little to do with this debate. Even if the RPI perfectly did it’s job (of measuring how much to reward teams for their performance on the season), it would have failed the test in this article. Let’s take a deeper look.
Comparing Ratings
To demonstrate this, I grabbed a few rating systems and checked how well they correlated with each other. Here are the ratings I used and where they fall on the descriptive-predictive spectrum.
- My Predictive Ratings: These are my own predictive ratings, created purely to be predictive of future results. Purely Predictive.
- Sagarin Ratings: Sagarin provides three ratings, Predictor, Elo Chess, and Overall Rating. The Predictor is mostly predictive, the Elo Chess is purely descriptive, and the Overall Rating is a combination of both.
- KenPom Ratings: Ken Pomeroy’s ratings are mostly predictive.
- ESPN’s BPI: ESPN’s new rating system takes into account margin of victory, injuries, and pace, but also makes adjustments for blowouts and ensures that all wins are better than losses. It is a combination but probably leans slightly more to the predictive side.
- My Achievement Ratings: These are the ratings I use for my Achievement S-Curve. They are purely descriptive.
- RPI: RPI is a purely descriptive rating.
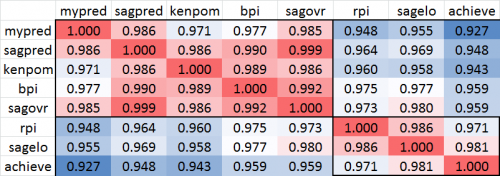
 This chart shows the correlations between all 8 rating systems, with red indicating a higher correlation and blue indicating a lower correlation. I have boxed the upper left and bottom right sections. We can see that the predictive-leaning metrics correlate well with each other, and the descriptive metrics correlate well with each other.
The RPI correlates poorly, as expected, with my own predictive ratings, Sagarin Predictor, and Ken Pom. We see a slightly higher correlation with the combination ratings: BPI and Sagarin Overall. RPI correlates best with Sagarin Elo. The correlation with my Achievement Ratings is a little lower, but these ratings correlate much more poorly with all the predictive/combination ratings and RPI is its 2nd-closest rating.
Look, it’s no surprise that metrics that are attempting to measure similar things end up producing similar results. The RPI actually correlates rather well with Sagarin’s Elo ratings, a very highly-respected set of ratings that aims to be descriptive just like the RPI.
As I have stated in the past, if Norlander prefers to select teams based on their true strength, that is perfectly legitimate and KenPom, Sagarin Predicotr, LRMC, and similar systems are a great way to go. In addition, part of Norlander’s argument is that the RPI also feeds into the strength of schedule portion of the committee’s team sheets: things like record vs. RPI Top 50, losses vs. RPI 200+, etc. I very much agree with him here that we should use the true strength of a team’s opponents to determine strength of schedule, and in fact that’s exactly how my Achievement Ratings work. However, neither of those opinions mean that the RPI is wrong. It’s just measuring something different that many simply don’t care to measure.
In the end, the RPI is a flawed metric, but not for these reasons. We can’t judge something against a standard it never set out to meet or a job it was never meant to fulfill.
