Quick update on the Achievement S-Curve.
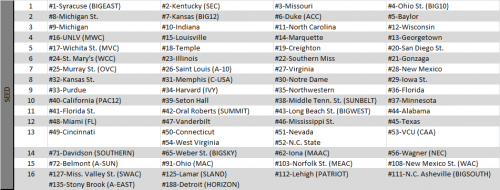
First, the bracket and the full ASC data here:
The ASC is converging with Bracketology. Besides differences in doling out the automatic bids, just two of Lunardi’s at-large teams were not in my bracket–BYU and Arizona–and they were my very first two teams below the cut line. One of the two spots went to Nevada since I give the WAC auto bid to New Mexico St. The other went to Northwestern, who I have all the way up at a 9-seed. I think the Wildcats are not being given due credit for their tough schedule, which I have ranked 10th toughest. Since I touched on Northwestern last week, I’ll use another Big Ten team that I believe is underseeded as this week’s example: Illinois.
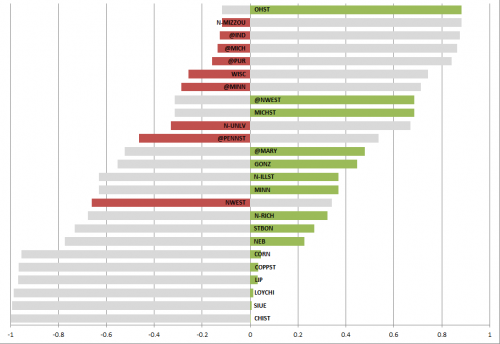
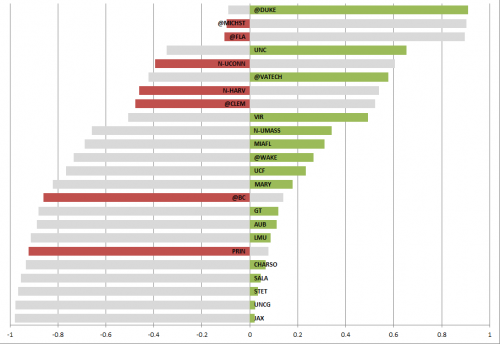
Bracketology has the Illini as a 12-seed while the ASC sees their resume as worthy of a 6-seed. For comparison’s sake, since I have already picked on Florida in the past, I’ll spare them and go after their in-state rival Florida St. (#11 in the ASC, #6 in Bracketology). I’m going to debut a new tool to help display a team’s schedule. These graphs show a team’s schedule from toughest game to easiest. Green bars show wins while red bars indicate losses. The gray bars represent the opposite score for that game should the outcome have been flipped. This allows us to see exactly how a team is arriving at its score.
Here are the graphs (no cool name yet, but I should come up with one) for Illinois (on top) and Florida St. on the bottom (try clicking twice to view them larger).
Both have a great win and two very good wins. As I’ve harped on in the past: location matters. Illinois’ win AT Northwestern is equivalent to Florida St.’s HOME win over North Carolina. Conversely the Seminoles win AT Virginia Tech is nearly as good as the Illini’s victory at home against Michigan St.
The big difference is that Florida St. has two horrible losses: @Boston College and home to Princeton. As a Princeton alum, I don’t like to call losses to my Tigers “terrible”, but I have to admit it’s not the greatest of losses this year. Illinois meanwhile has 6 losses that together don’t add up to the Princeton loss.
Remember, Achievement Scores are based on what we’d expect a baseline (average tournament team) team to do against that schedule. In Illinois’ case, the baseline team would be expected to lose 11.3 times against their schedule. The Illinois have lost just 9 times, that’s 2.3 wins better than expected…and that’s their score: 2.3. Florida St.’s schedule is a bit easier, just 8.1 expected losses for the baseline team. The Seminoles have 7 losses for a score of 1.1. I’m not quite sure why the huge disparity, but at the very least these teams should be seeded near each other–the 6 seed edge for FSU doesn’t quite make sense upon closer examination.
Projected S-Curve
Last week I introduced my rest-of-season simulator to project who would fall where. Here’s an update, with all teams that have at least a 10% change at an at-large berth (*% At-Large is probability of at-large bid in scenarios where team did not receive automatic bid).
| Team | True Strength Rank | % In | % Auto | % At-Large* | Avg Seed | Avg Score | % #1 Seed |
|---|---|---|---|---|---|---|---|
| Ohio St. (BIG10) | 1 | 100 | 56 | 100 | 1.2 | 10.8 | 86 |
| Syracuse (BIGEAST) | 6 | 100 | 43 | 100 | 1.3 | 10.1 | 76 |
| Kentucky (SEC) | 3 | 100 | 59 | 100 | 1.3 | 9.9 | 74 |
| Missouri (BIG12) | 4 | 100 | 39 | 100 | 1.4 | 9.8 | 67 |
| Kansas (BIG12) | 2 | 100 | 50 | 100 | 1.6 | 9.1 | 45 |
| Michigan St. (BIG10) | 8 | 100 | 11 | 100 | 2.2 | 8.2 | 20 |
| Duke (ACC) | 7 | 100 | 42 | 100 | 2.2 | 8.1 | 13 |
| Baylor (BIG12) | 15 | 100 | 5 | 100 | 2.5 | 7.5 | 7 |
| Indiana (BIG10) | 12 | 100 | 5 | 100 | 2.9 | 6.9 | 3 |
| Michigan (BIG10) | 13 | 100 | 6 | 100 | 2.8 | 6.9 | 5 |
| Wisconsin (BIG10) | 5 | 100 | 18 | 100 | 2.9 | 6.8 | 3 |
| North Carolina (ACC) | 10 | 100 | 35 | 100 | 3.1 | 6.6 | 2 |
| Georgetown (BIGEAST) | 21 | 100 | 13 | 100 | 4.2 | 5.1 | 0 |
| Marquette (BIGEAST) | 16 | 100 | 14 | 100 | 4.3 | 5.0 | 0 |
| Louisville (BIGEAST) | 24 | 100 | 9 | 100 | 4.8 | 4.6 | 0 |
| UNLV (MWC) | 22 | 100 | 62 | 100 | 4.9 | 4.4 | 0 |
| Wichita St. (MVC) | 18 | 100 | 46 | 100 | 5.0 | 4.3 | 0 |
| Creighton (MVC) | 25 | 100 | 35 | 100 | 5.7 | 3.7 | 0 |
| Saint Louis (A-10) | 11 | 100 | 56 | 100 | 6.1 | 3.5 | 0 |
| Illinois (BIG10) | 27 | 100 | 1 | 100 | 6.7 | 3.1 | 0 |
| Gonzaga (WCC) | 28 | 100 | 35 | 100 | 7.0 | 2.9 | 0 |
| Purdue (BIG10) | 14 | 100 | 3 | 100 | 7.3 | 2.8 | 0 |
| Florida (SEC) | 9 | 100 | 30 | 99 | 6.0 | 3.6 | 0 |
| Temple (A-10) | 46 | 99 | 11 | 99 | 6.8 | 3.1 | 0 |
| St. Mary's (WCC) | 19 | 100 | 54 | 99 | 6.9 | 2.9 | 0 |
| Virginia (ACC) | 23 | 99 | 11 | 98 | 6.8 | 3.0 | 0 |
| Kansas St. (BIG12) | 17 | 98 | 3 | 98 | 7.8 | 2.5 | 0 |
| Iowa St. (BIG12) | 32 | 98 | 1 | 98 | 8.4 | 2.1 | 0 |
| Southern Miss (C-USA) | 44 | 98 | 17 | 97 | 7.9 | 2.3 | 0 |
| New Mexico (MWC) | 33 | 95 | 20 | 94 | 7.8 | 2.3 | 0 |
| Notre Dame (BIGEAST) | 39 | 94 | 4 | 94 | 8.5 | 1.9 | 0 |
| San Diego St. (MWC) | 69 | 92 | 5 | 92 | 8.6 | 1.8 | 0 |
| Minnesota (BIG10) | 37 | 92 | 0 | 92 | 9.2 | 1.6 | 0 |
| Memphis (C-USA) | 29 | 96 | 65 | 90 | 8.0 | 2.3 | 0 |
| Alabama (SEC) | 26 | 91 | 7 | 90 | 9.0 | 1.6 | 0 |
| Northwestern (BIG10) | 42 | 91 | 0 | 90 | 9.1 | 1.6 | 0 |
| California (PAC12) | 35 | 92 | 34 | 89 | 9.1 | 1.6 | 0 |
| Florida St. (ACC) | 34 | 90 | 7 | 89 | 8.9 | 1.6 | 0 |
| Texas (BIG12) | 30 | 87 | 2 | 86 | 9.4 | 1.3 | 0 |
| West Virginia (BIGEAST) | 20 | 83 | 6 | 81 | 9.7 | 1.1 | 0 |
| Murray St. (OVC) | 83 | 94 | 68 | 80 | 9.4 | 1.5 | 0 |
| Seton Hall (BIGEAST) | 51 | 80 | 1 | 80 | 9.7 | 1.0 | 0 |
| Middle Tenn. St. (SUNBELT) | 52 | 90 | 54 | 78 | 10.1 | 1.1 | 0 |
| Connecticut (BIGEAST) | 31 | 77 | 5 | 76 | 9.4 | 1.1 | 0 |
| Vanderbilt (SEC) | 41 | 73 | 2 | 72 | 10.2 | 0.7 | 0 |
| Cincinnati (BIGEAST) | 40 | 70 | 2 | 70 | 10.0 | 0.7 | 0 |
| Mississippi St. (SEC) | 49 | 66 | 2 | 66 | 10.1 | 0.5 | 0 |
| Oral Roberts (SUMMIT) | 65 | 79 | 45 | 61 | 10.5 | 0.8 | 0 |
| Miami (FL) (ACC) | 48 | 59 | 2 | 58 | 10.5 | 0.2 | 0 |
| Long Beach St. (BIGWEST) | 63 | 87 | 73 | 52 | 11.1 | 0.6 | 0 |
| Harvard (IVY) | 38 | 99 | 97 | 48 | 9.7 | 1.5 | 0 |
| N.C. State (ACC) | 61 | 43 | 2 | 42 | 10.7 | -0.2 | 0 |
| Xavier (A-10) | 45 | 34 | 8 | 28 | 11.3 | -0.5 | 0 |
| BYU (WCC) | 57 | 35 | 10 | 27 | 11.4 | -0.4 | 0 |
| VCU (CAA) | 58 | 56 | 46 | 19 | 12.1 | -0.3 | 0 |
| Arizona (PAC12) | 75 | 22 | 10 | 14 | 11.7 | -1.0 | 0 |
| Massachusetts (A-10) | 87 | 14 | 2 | 12 | 11.3 | -1.2 | 0 |
| UCF (C-USA) | 73 | 18 | 6 | 12 | 11.9 | -1.2 | 0 |
The Super 12
The top 12 teams have clear separation. Don’t be surprised if these 12 teams fill up the top 3 seed lines in a month: Ohio St. (BIG10), Syracuse (BIGEAST), Kentucky (SEC), Missouri (BIG12), Kansas (BIG12), Michigan St. (BIG10), Duke (ACC), Baylor (BIG12), Indiana (BIG10), Michigan (BIG10), Wisconsin (BIG10), and North Carolina (ACC). Those 12 schools took all 12 of the top seeds in 21% of simulations. Overall, out of 12,000 available top 3 seeds in the simulation, just 1,003 went to other teams. Including the super 12 teams, there are 41 teams that have a 90% chance or better to be in the tournament.
That’s it for today. Later this week, I’ll take a look at the importance of seeding and why those 41 near-locks have plenty to play for in the regular season’s final month.


