 Full disclosure: I’m a Peyton Manning fan. If you can’t get past that, stop reading now. Still there? Good, welcome.
Following the Broncos recent loss to the Ravens (and the subsequent Patriots loss), there has been a new wave of the old Manning vs. Brady argument. Clutch vs. choke. Winner vs. can’t-win-the-big-one. Add in another playoff loss for Matt Ryan and a couple big wins for Joe Flacco, and the debate is raging like never before.
If you’re reading this, you’ve probably at least touched on the subject this January. I have. The debate always seems to deteriorate into emotional arguments filled with snarky retorts and anecdotal “evidence”. Tuck Rule game is countered with the Helmet Catch. The Flacco Prayer is answered with the Tracy Porter pick six. And on and on. And on. Every quarterback has been lucky, and every quarterback has been unlucky. Everyone can bring up some argument to support their claim. Without looking at the entire picture, we’ll never reach a valid conclusion. There has to be a better way.
A Clean Slate
So, I’ve decided to start from the beginning. Just how should we evaluate quarterbacks, both their entire careers and specifically their postseason performance? No more confirmation bias. No anecdotes. We’re starting with a clean slate. First we’re going to lay out the process and then we’re going to see what conclusion that leads us to. Not the other way around.
In part one of this series, we’re going to start with the Quarterback Win.
A Win is a Win…Unless It’s Not
As fans, we always do this. We try to simplify our evaluations and assign full credit or blame for the outcome to the player with the most influence. Pitchers. Goalies. Quarterbacks.
To test the validity of this, I’m going to use a two-step process. First, we’ll determine what helps teams win games. Second, we’ll see how much influence quarterbacks have over each of those components.
The main tool I’ll be using here is called Expected Points Added (or EPA for short), a tool that takes every play and determines how much that play helped or hurt each team based on how many points they’d be expected to score in that situation. Brian Burke at AdvancedNFLStats is a recent pioneer of EPA in football, and explains it better than I can here. What makes EPA such a good fit for this analysis is that it is only concerned with the situation before and after the play, no other context is needed. This is helpful for assigning credit or blame only to the play in question.
For example, take two scenarios. In scenario 1, the offense drives 80 yards for a TD, and in scenario 2, that same team’s defense scores on an interception return for a TD. If we were using points scored to evaluate teams, in both cases the offense would get credit for 7 points when in reality one of the scores was completely out of their hands. We could start trying to control for that by removing defensive scores, but then what about an 80-yard TD drive versus a 20-yard TD drive? Clearly the defense/special teams deserves some more credit for creating the field position on the second drive. EPA accounts for all of these things inherently, so we can divide up credit to each phase of the game correctly.
So, to start, let’s split the game into 3 categories: offense, defense, and special teams. We can sum up the EPA for each phase in every game and see how often teams win. Here’s the chart for Offensive and Defensive EPA (negative Defensive EPA is good).
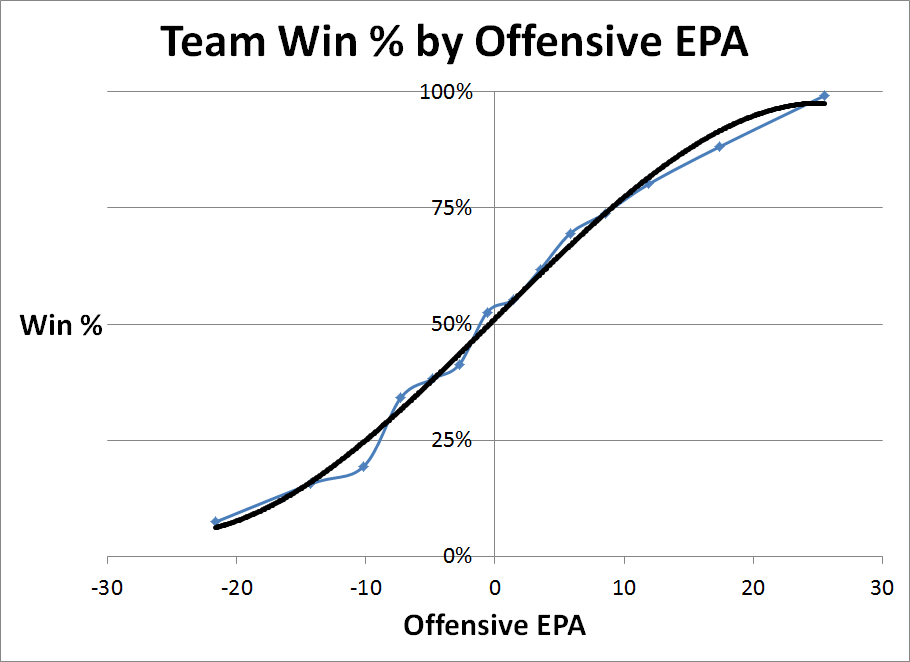

These charts show a relatively strong relationship between Offensive and Defensive EPA and Win %. As we’d expect the zero-EPA point intersects at the 50% line. EPA is based on the average expectation so 0 EPA is exactly average. Let’s now combine offensive, defensive, and special teams EPA, and plot that total game EPA against winning percentage.
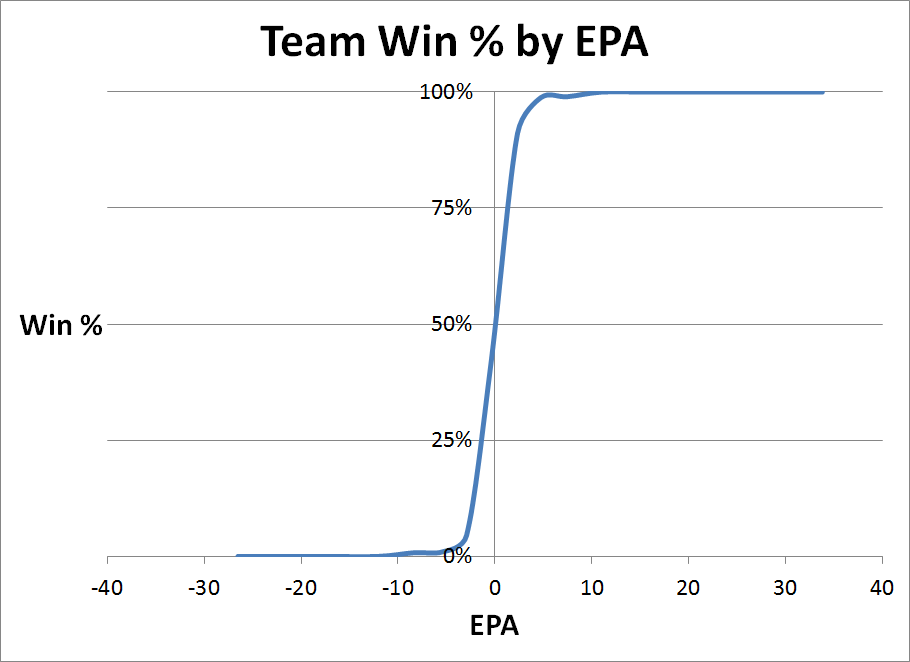
Wow, look at that, we can nearly perfectly predict the outcome by EPA. Of course, this is expected as EPA should be nearly exactly the same as point differential, which obviously perfectly predicts the outcome of the game. In fact, the reason EPA doesn’t perfectly mirror the outcome of games is likely just some slight inconsistencies with its calculation. We can plug this into a regression, and see how much of the variance in wins is predicted by EPA. Doing this, we get an adjusted r-squared of 0.856 which essentially means our 3 variables (off EPA, def EPA, and special teams EPA) explain nearly all of the variance in winning. In other words, given those 3 variables, we can correctly predict the outcome of over 95% of games.
Okay, we already knew that points wins games, that’s nothing new. We just dressed up points in a fancy disguise so that we can divide it up more easily.
Which components do QBs control?
We know that team EPA is highly explanatory of wins, and team EPA = Offensive EPA – Defensive EPA + Special Teams EPA (remember Defensive EPA is good when negative, so we subtract instead of add).
Now we want to know which of those phases of the game quarterbacks have the most influence over. I’m going to go one step further and separate offensive EPA into Quarterback EPA and Non-QB EPA. That is, when the team is on offense, if the quarterback is either the rusher or passer then that is QB EPA and all other offensive plays are Non-QB EPA.
Since we want to isolate the quarterback from his team, I took all quarterbacks in my set (2000-2012) and divided the games up between the different teams he played for. As long as the QB played at least 10 games for two different teams, he is included. I then looked at each component and plotted the EPA for the QB on the team in question on the horizontal axis and the EPA for all other teams on the vertical axis. The more influence the quarterback has on that part of the game, the steeper the slope of the line should be. Perfect correlation should result in a line at 45 degrees. The flatter the line, the less influence the QB has. Here’s what we get:
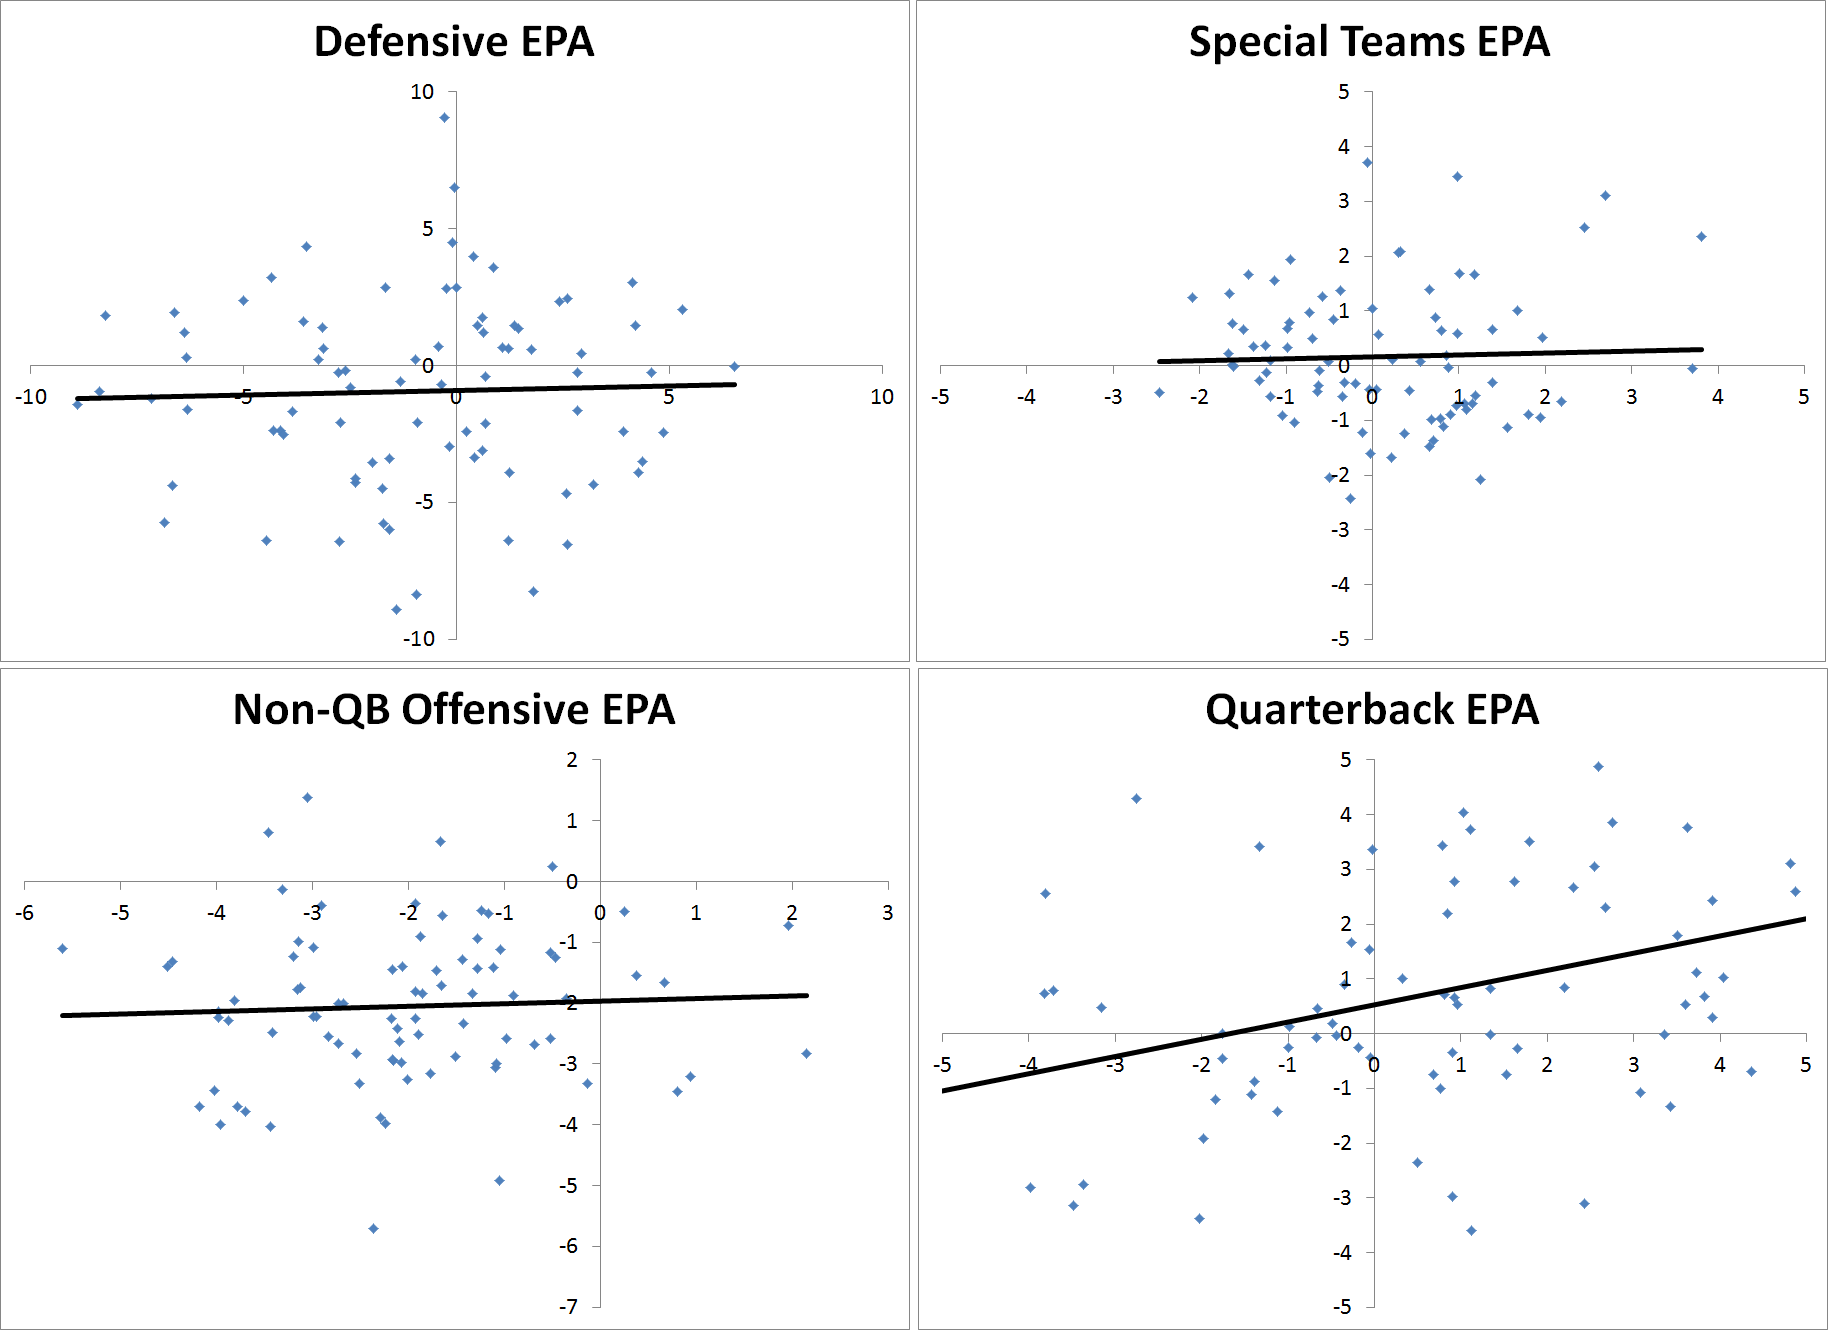
Again, as expected we see that the QB has no influence on Defensive EPA, Special Teams EPA, or Non-QB Offensive EPA (mostly running plays). However, the QB does have a good deal of influence on plays he’s directly involved in as either the passer or rusher. It’s important to note that “Quarterback EPA” is really “Team Offensive EPA on plays the QB is directly involved in”; thus, the receivers, running backs, tight ends, offensive line, play calling, coaching scheme, etc. all have influence on this as well. Still, we find a rather strong correlation even between teams for a QB on these plays.
As a final check, let’s make sure that these components not only affect team wins, but also specifically a quarterback’s winning percentage. I’ll take every quarterback and look at his winning percentage with good support (positive EPA, or in the case of defense, negative EPA) and with bad support. We’ll take the average effect on each QBs winning percentage.
With good defense, QB’s win on average 66% of the time, but just 25% of the time with a bad defensive effort. So the difference between good and poor defensive support is 41 percentage points. This is with relation to the same quarterback, so even keeping the QB constant we see that Defensive EPA has a huge effect on whether or not the QB wins.
Conclusion and Next Steps
In Part 1 of this series on evaluating QBs we laid the groundwork. First, we determined what wins games. Using EPA we were able to nearly perfectly explain wins, but it allows us to easily divide the EPA credit/blame into sub-components. Next, we proved that while QBs have influence on the plays they are directly involved in, they do not have any influence on defense, special teams, or even offensive plays they’re not directly involved in. Finally, we took a sanity check and ensured that components that QBs don’t have control over still affect the outcome of games they play in, even holding the QB constant.
Armed with this information, we can now dive deeper than just a quarterback’s win-loss record and determine how much of those wins and losses should be credited to him. Next time, we’ll look at Expected Wins by quarterback based on things he controls: not just EPA but WPA (Win Probability Added) and some more traditional statistics. Eventually, we’ll look at specific QBs and of course conclude with what started this whole series: a look at the Manning-Brady debate through our new lens.