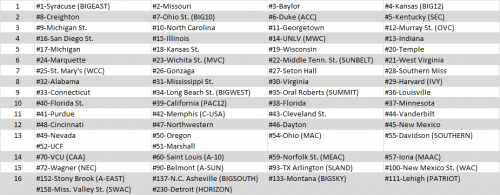
Those following along (those that have not, start here, here, and here) know that the goal of the Achievement S-Curve is to reward teams for what they have accomplished on the court. Wins and losses count. Strength of schedule counts. Scoring margin, the eye test, true team strength…they don’t count.
There are good arguments against simply selecting and seeding teams based on who is the most deserving as opposed to just the best teams. For one, some people simply prefer to select the best teams and see them go at it in the tournament. Secondly, while seeding teams based on achievement rewards the top teams with good seeds and likely easier paths in the tournament, you may sometimes inadvertently hurt some of these teams who draw teams that underachieved during the season. Take Washington as an example from last season–they were a top 10 team by some rankings of the best teams but underachieved and drew a 7-seed. A team that earned a 2-seed would actually be better off as a 3-seed drawing an easier 6-seed as opposed to being slotted across from the Huskies.
So, this week, I offer two alternative S-Curve systems: Continue reading


 Last year, I introduced the Achievement S-Curve. The idea behind it was that teams should be rewarded for their season based on their wins and losses and the strength of their schedule. This is in opposition to the other camp of evaluating and seeding teams for the tournament, where teams are judged based on who is the “best” regardless of record. I discuss this dichotomy in further detail in
 As a Colts fan since the Harbaugh days, I remember the last time the Colts had the number 1 pick. The decision then, however, was much different. Indianapolis was definitely drafting and keeping a QB, it was just a matter of who: Peyton Manning or Ryan Leaf. Bill Polian made the right choice and the Colts have benefited with one of the best sustained runs of excellence in NFL history.
 For those that have read the first five installments of my BCS Ratings review, you’ll notice one major theme: nobody publishes their full methodology for how they calculate their ratings. Many of them are a “black box” where the inputs go into, some magic happens, and the output comes out. Well, the final review is of the Colley Matrix rating system and he publishes
  The Massey ratings have been around since December of 1995, according to
  Continuing with my review of BCS computer rating systems, the 4th of the 6 systems in my series is
  In the third installment of my review of the BCS computer rankings, I will take a look at the ratings of Anderson and Hester. For starters, they have a great tagline on their
  Next up in my review of the computer ranking systems in the BCS is Richard Billingsley. He gives a much more detailed explanation of his ratings on his website:
  Jeff Sagarin produces some of the most respected ratings, not just for college football but for the NBA, NFL, college basketball, and others. His ratings, found