I will try to update this every week, though I won’t provide nearly as much commentary. For an introduction and explanation, try these three posts.
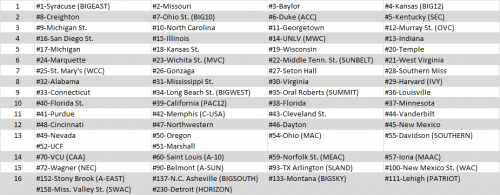
This week, I’ll get right to it with the chart. As always, the full S-Curve with additional information can be found here.
This week, I’ll tie in some comments about this week’s ASC as examples for what are the main differences between my ratings and ESPN’s Bracketology by Joe Lunardi (and other similar “bracketology” predictions).
- Accounting for injuries: It is really close for the top seed line between my top 5 teams: Syracuse, Missouri, Baylor, Kansas, and Kentucky. Lunardi adds in Ohio State as the 4th top seed and part of that may be due to Sullinger’s injury, which the committee accounts for but I do not.
- True Strength versus Accomplishment: In many cases, teams that are over or underseeded by ASC compared to Bracketology are due to this distinction. Obviously, my system is based purely on accomplishment to date, while Lunardi factors in a team’s true strength at least somewhat. Temple, Cleveland St., Southern Miss, and Illinois (all seeded higher by ASC) and Florida, UConn, and Florida St. (all seeded lower by ASC) are examples from this week’s bracket.
- “Big” Wins: Teams with lots of above average but few if any great wins tend to be rated higher in the ASC. This could be a matter of preference, and perhaps tweaking my “baseline” team to a higher level would account for this. However, I think much of it is a lack of respect for wins against teams in the 75-150 range. Lunardi often brings up a team’s “record against tournament teams”. Mid-major teams suffer from this as they have few chances at marquee victories and don’t get enough credit for piling up victories against tough but not great teams. Murray St., Creighton, and Middle Tennessee St. are the poster children this year. West Virginia is an example of a team on the opposite side who benefits from this difference of analysis.
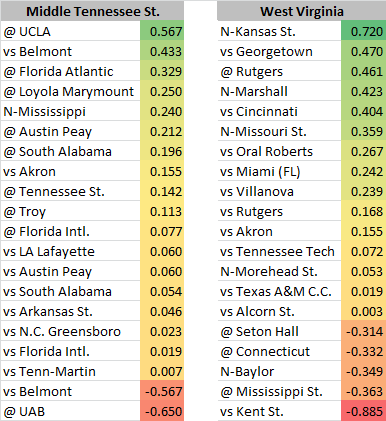
Let’s take a closer look at this last point. I have West Virginia and Middle Tennessee St. right next to to each other on the S-Curve with both as 6-seeds. Lunardi has them nine seeds apart, with WVU as a 3 and MTSU as a 12 seed.
While MTSU is not getting enough credit for road wins at UCLA, FAU, and LMU or a home win against Belmont, West Virginia must be getting huge credit for wins against Georgetown, Cincinnati, and Kansas State. As I pointed out last week, location is huge, and MTSU has 5 of its 7 best wins on the road. West Virginia, on the other hand, has just one–at Rutgers. Additionally, the Mountaineers have 5 losses compared to just 2 for MTSU. Clearly, strength of schedule plays a huge role in this, but how much? Luckily, ASC is made perfectly for this.
The strength of schedule that the ASC outputs can be read as “how many losses would a baseline team (i.e. average tournament team) expect to have against this schedule”? Middle Tennessee St.’s easier schedule says just 3.8, while West Virginia’s harder schedule says 6.8–a difference of 3 losses expected. West Virginia is 15-5 and Middle Tennessee St. is 18-2–also a difference of 3 losses. Awesome. The Blue Raiders should be expected to lose 3 fewer games than the Mountaineers and they have, meaning the teams have accomplished a similar amount thus far. To get a 9-seed difference is a big problem.
Next week, I’ll go into further detail of how strength of schedule and win-loss record interact in the ASC ratings.


