Amazingly, the Achievement S-Curve matches up well with the traditional Bracketology projections out there such as the one at ESPN. The only current differences between my ASC and ESPN’s Bracketology occur at the very end of the bracket. All of Lunardi’s tournament teams are at least in my first 6 teams out of the bracket and all of my tournament teams are at least in his first 4 out. Except one.
All year, the biggest discrepancy between the Achievement S-Curve and traditional s-curves has been Iowa. Until recently, they weren’t even among those considered for the bracket. They have now snuck their way not into the First Four Out or the Next Four Out, but as the Ninth Team Out and last team considered for ESPN’s bracket. Now, the Hawkeyes are no perfect team, and what I love about the NCAA Tournament as opposed to the BCS is that there are no real “snubs”. If you’re not one of the top 34 non-automatic qualifiers, you don’t have much of a gripe.
That said, we can still try to pick the 34 most deserving at-large teams and Iowa certainly appears to be in the heart of that discussion. The Hawkeyes are 19-11 against what I measure as the 10th toughest schedule in the country. However, teams that appear much more flawed are listed ahead of them. Let’s take a look at a few of the issues that are influencing this misperception.
1) Playing the 300th best team in the nation isn’t much different than playing the 200th best team.
But the RPI doesn’t think so. I’ve detailed why the RPI isn’t wrong for the reasons most people think, but it still does have flaws and this is one of them. The RPI measures strength of schedule by the winning percentage of your opponents and their opponents. There are a couple of reasons why this isn’t ideal, but one of them is that it treats the difficulty of playing different opponents linearly when in reality it is far from that. We are judging potential tournament teams, so to more accurately represent their strength of schedule we should be looking at how difficult each game is for a tournament team.
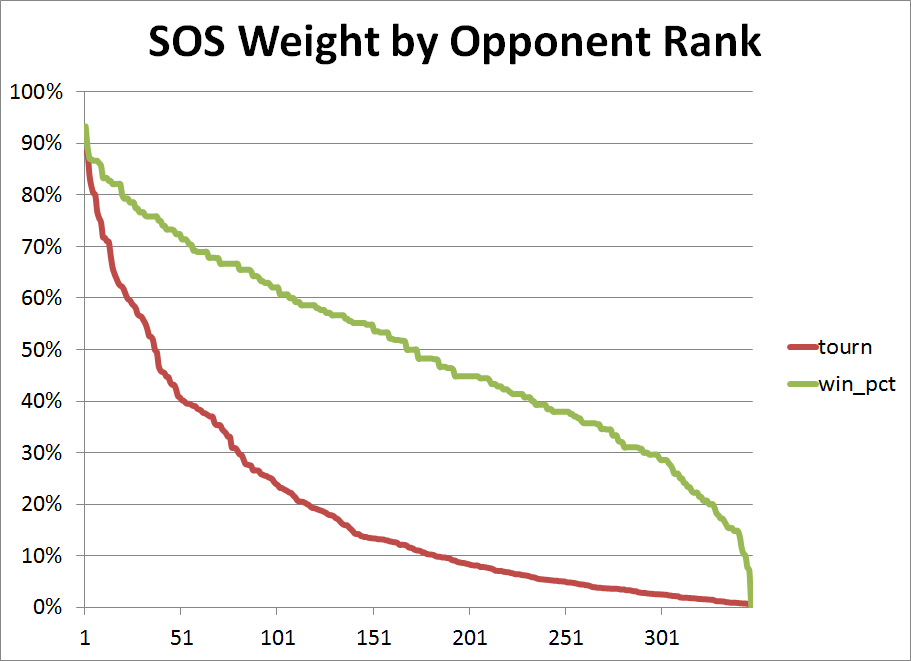
In the below chart, the green line shows winning percentage for each team. As you can see, except for the very extremes the line is very linear. Since RPI uses this for its SOS component, the difference between playing the 250th vs 300th teams will be the same as the difference between the 50th and 100th. In reality, most tournament quality teams will have little trouble with any team in the bottom half of the country, but the 50th best team will present a much steeper test than the 100th best team. The red line shows a much different, non-linear curve. From the worst team in America to the 100th-best team is just a 20% range–that is the 100th best team will beat an average tournament team only about 20% of the time, not much higher than the worst teams in the land. But between #100 and #1 that percentage climbs dramatically. Scheduling 10 patsies will get you 10 wins but little credit in your SOS, as it should. But scheduling 10 teams in the 150-200 range might get that team another loss or two, but it’ll look like they did much better than expected since those teams will have records around .500!
Iowa played 7 teams in the non-conference ranked 250th or worse, but they also played top 100 teams Wichita State, Iowa State, and Northern Iowa. The RPI has Iowa’s non-conference SOS at 313. My system doesn’t change the story a ton, but it does move the Hawkeyes inside the top 300. They still played a terrible out of conference schedule, but this system adjusts that and gives them some credit for their handful of tougher games. Then again, some of this should be moot since…
2) Non-conference SOS shouldn’t be a factor.
I’m not really sure why we separate out non-conference SOS. If you don’t want teams to get too much credit for a gaudy record against a cupcake schedule…well, stop giving them too much credit. If we simply adjust correctly, it shouldn’t matter what kind of schedule a team plays. Play an easier schedule, you better win more games. Play a tougher schedule and you have a little more margin for error and we’ll excuse a couple losses.
Regardless of that, strength of schedule is strength of schedule. If two teams play the same schedule, but one team played an average schedule both in and out of conference while the other team plays an easy non-conference but tough in-conference schedule…what does it matter? Who cares that Gonzaga played Indiana in the non-conference while Iowa plays them in conference? In Iowa’s case, they have played the 4th most difficult conference slate. There is also a much bigger spread in conference SOS, which gives Iowa the 10th-toughest schedule overall. This is really where the issue above comes into play: the RPI doesn’t correctly account for the spread in SOS, so the RPI gives Iowa just the 115th SOS. That’s a massive difference, and it will likely cost the Hawkeyes an at-large berth.
3) The Big Ten is REALLY good.
As you could probably tell from the last paragraph, the Big Ten is ridiculously good. Iowa has played 9 teams in conference play ranked 14th or higher in KenPom’s rankings, 5 of those on the road. A couple things here: first, I think at the extremes, people have a tough time correctly adjusting for really difficult or easy schedules. Yes, Iowa has piled up the losses, but against their schedule, just winning a couple of those difficult games is praiseworthy. Secondly, I think the RPI’s win/loss based strength of schedule calculation fails to account for the strength of a really good conference like this year’s Big Ten. Since obviously every conference goes .500 in conference play, this will hurt the top conferences’ SOS numbers. Ohio St., Wisconsin, Michigan St., and Minnesota are all in the top 14 of KenPom’s ratings, but they all also have 7-9 losses. Nobody else in the top 14 has more than 5.
So how is Baylor rated higher on the S-Curve than Iowa?
This one I just don’t get. Baylor has a worse record (16-13) than Iowa (19-11) against an easier schedule (44th vs. 10th). It’s just not even close. It’s not even like Baylor has a bunch of big wins or good conference standing or recent winning streak that usually cloud this process. It must come down to the RPI and specifically the SOS component, which allows Baylor to be ranked a few spots ahead of Iowa.
Baylor is the most egregious example, but there are others. In-state rival Iowa State has a nearly identical record (19-10) against a much easier schedule (72nd). The Cyclones did get a big win tonight against Oklahoma State that’s not yet included.
Other Tidbits
-Duke is my #1 overall team, yet they are a 2-seed in Bracketology because more of their losses have come against the ACC and not Florida Gulf Coast so they trail Miami in the conference standings.
-Georgetown is a 1-seed in Bracketology but just 8th in my rankings. Again, it’s likely because they lead Louisville in the standings. Their loss to Villanova tonight should drop them back down.
-New Mexico is my top 2-seed, but gets a 3 in Bracketology. The Mountain West should not be underrated, it is easily a “major” conference this season.
Overall, it’s remarkable how closely a purely automated, objective system can mirror the current process. Sometimes when they differ, the bracketologists are right: for instance, with injuries (Kentucky). However, often, it is the humans who are missing something. It’s really simple, all you need are the answers to two questions: How many games should you have won? and How many games did you win? Iowa, you deserve better.