In part 1 of my Evaluating QBs series, we looked at what makes teams win and which of those things quarterbacks have control over. While wins can be useful to separate quarterbacks, that is only because they are correlated with the underlying factors that explain wins. Once we separate out and control for those factors, QB wins provide no further information.
Now that we have shown that QBs have some control over the plays they are directly involved in but no influence over other facets of the game–defense, special teams, and other offensive plays–we can now look at how many wins we’d expect each player to have based only on what they have control over.
We can get at this two ways: directly and indirectly. The direct way is to look at how often quarterbacks win based on their EPA (again, using Brian Burke’s Expected Points from Advanced NFL Stats). The indirect way is to look at how often quarterbacks win based on the EPA of everything else, what I’ll call “support”. That is, the sum of the EPA of the quarterback’s team defense, special teams, and non-QB offensive EPA.
Expected Wins by QB EPA
Let’s start by looking at the general relationship between a QB’s EPA and the winning percentage in those games.
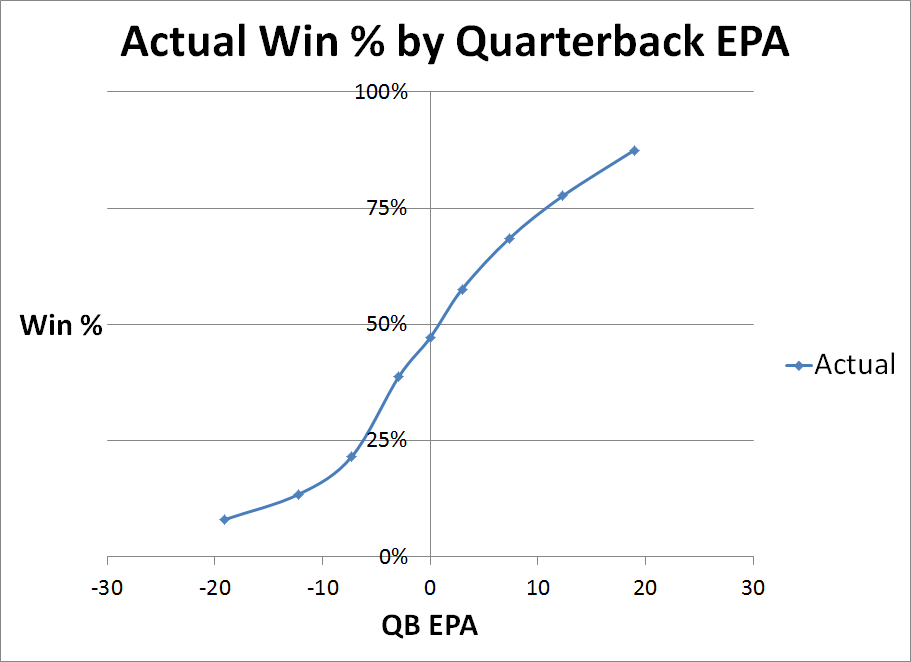
The chart shows how often quarterbacks can expect to win based on their production in that game. Note that 0 EPA is actually a below average game for a QB and he should be expected to lose more than he wins. Although the EPA baseline is average, due to the fact that passing is more lucrative than running in today’s NFL, quarterbacks need to produce positive EPA in order to keep pace.
To get an expected winning percentage for any QB EPA, I ran a logistic regression of QB EPA against wins. EPA has increased over time in my set*, so I also included a variable for the season to reflect that more EPA is needed to win now than it was back in 2000. For example, in 2012 a QB posting an EPA of +5 would be estimated to win 57.3% of the time, while an EPA of -5 would drop the estimate to 27.5%. Because of the increasing QB EPAs, those same totals in 2000 would win 64.8% and 34.3% of the time, respectively.
*The average QB EPA has risen about 2 EPA per game from 2000 to now. It rose from under +1 EPA per game in the early 2000s to nearly +3 EPA in 2012. QB EPA in wins rose from +5 to +7.5 and in losses, QB EPA started around -4 EPA and is currently around -2 EPA.
Here’s how the estimates compare to the actual win rates by QB EPA.
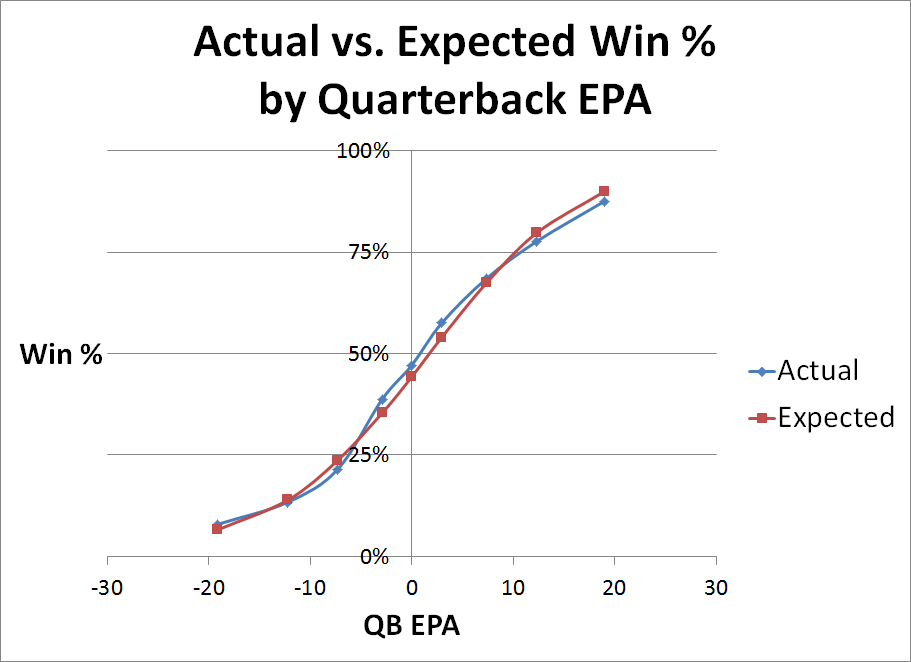
This includes all seasons together, but regardless, the Expected estimate closely matches what actually happens.
Expected Wins by Support
The first method looked at winning percentage by isolating the involvement of the QB. The other side of the coin is to look at everything else and see how often teams should be expected to win. The difference between that and how many games the team actually won should be some combination of luck and the responsibility of the QB (and his offensive teammates).
To do this, we apply the same technique as before except instead of QB EPA we use Defensive EPA, Special Teams EPA, and Offensive Non-QB EPA. For example, based on the “support” each quarterback received this year, we’d have expected an average QB to win the most games given Jay Cutler’s support–75.7% win percentage. At the other end of the spectrum is the support Carson Palmer received, where an average quarterback would have won just 30.3% of his games.
What does this tell us?
Let’s start with the most direct estimation, Expected Win % by QB EPA, which I’ll refer to as xWin%. In my dataset from 2000-2012, xWin% ranges from Peyton Manning (68.6%) to Joey Harrington (39.7%) among QBs with at least 50 games*. The indirect estimation that is based on “support” I will refer to as sWin%. A QB’s sWin% is how often a QB should be expected to win based on how much support he got from his team in that game. Joe Flacco’s 64.6% sWin% is the highest in the set, while Daunte Culpepper’s 37.7% sWin% is the lowest, meaning he received the worst support from his team’s defense, special teams, and running game.
*Only the “QB of record” for each team is used. The QB of record is the player on each team with the most dropbacks (pass attempts plus sacks) in the game.
We can take xWin% and compare it to actual Win%. For example, Daunte Culpepper’s xWin% was 57.0% but he went just 41-55, a .427 winning percentage. That diff of -14% is the biggest in the set. As I just mentioned in the previous paragraphs, Culpepper had the worst sWin% of any quarterback as well. Comparing each QB’s sWin% to the difference between his xWin% and actual Win %, we see the same trend. The two numbers have a correlation of .88, showing an extremely strong relationship. Most of the difference between a QB’s xWin% and actual can be explained by the support he received in that game, support that we showed in Part 1 of this series that a QB has no control over.
Conversely, we can look at sWin% and compare that to actual Win%. The difference shows QBs who were able to outperform the expected win % based just on the support they got. Joey Harrington lost over 13% more games than expected (no other QB was even -10%) and again, in the first paragraph we see he had the lowest xWin%. We might guess that xWin% is correlated with the diff between sWin% and actual Win% and we’d be correct. The correlation between those two numbers is even slightly stronger at .91 (correlation is measured between -1 and 1, where the strongest correlation is measured closer to -1 and 1 and the weakest correlation being near 0).
So we have the relationship between QB EPA and Support EPA that we expected and we can look at it in two ways, both directly and indirectly. QBs with inflated Win-Loss records compared to their performance likely had positive support, and vice versa. Additionally, we can measure QB performance by those whose actual Win-Loss records outperformed what we’d expect based on the support they received. That indirect evaluation correlates well with xWin%.
It’s all about Context
Who would you choose to run your company: the CEO worth $2 million who built his company from scratch or the trust fund kid who inherited his $4 million from his parents? If all you know about two businessmen is their net worth, you’ll be better off choosing the one worth more. But if you know the context, you can better evaluate who is really the better businessman. In the same way, evaluating QBs based on win-loss record contains some information, but once we know the context that information is no longer useful. Continuing to dismiss context in evaluations when it is readily available is not just less accurate it is ignorant and lazy.
We laid out the process for re-assigning wins to QBs in this post and tomorrow we’ll look at more results. Who are the top QBs of the past 13 seasons? Which QBs have actually performed the best in the postseason? Who has been the luckiest and unluckiest in their careers based on the support (or lack thereof) they received from their teammates? Hint: You might see some Ravens QBs pop up once or twice.
Great stuff, Monte. I can’t wait to see how the likes of Peyton, Tim Tebow, Trent Dilfer, even Andrew Luck this year, grade out.
The flaw in this analysis is that teams that heavily in a passing offense at the expense of defense and/or special teams would unfairly inflate a QB’s value, and conversely, teams that heavily invest in defensive and/or special teams at the expense of passing offense would unfairly deflate a QB’s value.
For example, Peyron vs Flacco.