Football is finally back as college football kicks off its season tomorrow. As an early present, I’m unveiling an expected points model for the collegiate game.
First, due respects need to be paid. This is heavily influenced by the work over at AdvancedNFLStats.com, where Brian Burke has done the same thing for the NFL. Many others have done similar work in football as well. And most of the football work is based off work done in baseball, where, while not the first, tangotiger at The Book Blog is arguably the most well-known for his run and win expectancy work (for those familiar with baseball, run expectancy by base-out state is essentially equivalent to the expected points concept in football).
What Expected Points (EP) does is provide a baseline for a given situation based on what we’d expect the average team to do. My EP system, like Brian Burke’s, is based on Down, Distance, and Yardline, but other things like time remaining in the half, timeouts remaining, etc. can be included. By putting everything on same scale we have an easy way to compare any type of situation, and by using points as that scale, we have something that is both intuitive and informative. When I say that that 1st and 10 on your opponents’ 20-yard line is worth 3.9 points, you immediately have a sense of what that means.
Why Expected Points?
In my last post, I laid out the anatomy of a decision and stated that most decisions, in their purest form, are deciding which option provides the best chance of winning the game. So why not Win Probability (WP)? Well, first of all, it’s much more complicated to calculate as you have two additional dimensions in time and score. Due to this and other factors, it is also noisier than EP, meaning we’d have less confidence in our values. Additionally, the context provided by WP will make it much more volatile, and for many uses, we may not want those aspects included. Luckily, in most situations during a football game, maximizing the Expected Points will very closely parallel maximizing Win Probability. As it is simpler to calculate and more precise, in many instances it will be our preferred choice to evaluate decisions and other aspects of the game.
How is Expected Points calculated?
First, I start by looking at each play and grouping them by down, distance, and yardline. So that plays near the end of the half or in blowouts, where other factors are at play, do not influence the model, I excluded all plays in the last 6 minutes of the half (or OT) or when the score margin was more than 14 points. I used about 1,000 FBS and FCS games from 2010, after eliminating games without play-by-play or with too many errors.
For each play, I looked for the next score, by either team (7 points for a TD, regardless of whether the XP was made or not). However, since the team that scores must kickoff, I subtracted 0.7 points from each score, so that TDs are worth 6.3 and FGs are worth 2.3. There are other ways to estimate the net worth of each situation, but this method is simple and does a good job of capturing all the factors.
Once I have a raw expeced points value for each down-distance-yardline combination, I need to perform one last step. Since the data is still very noisy, I need to smooth all the data points. It makes no sense that 3rd and 3 from the 30 is worth more than, say, 3rd and 1 from the 28, but that can happen in the raw values due to small samples. To correct for this, I ran a LOESS regression, which essentially smooths all the values across all 3 dimensions of down, distance, and yardline. The result is that the values we now have are much more intuitive and accurate.
Expected Points Values
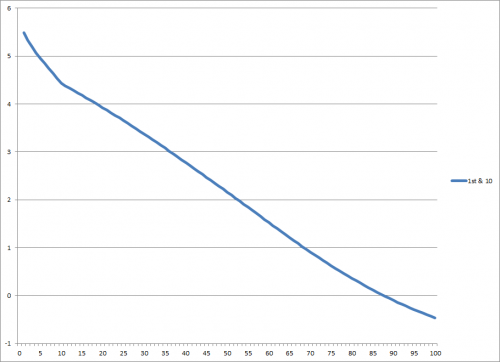
The bread-and-butter of expected points values is 1st-and-10 plays as they are by far the most common down and distance.
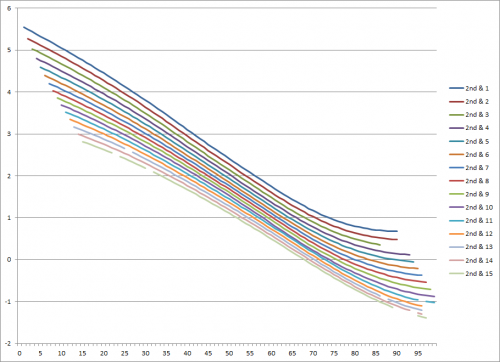
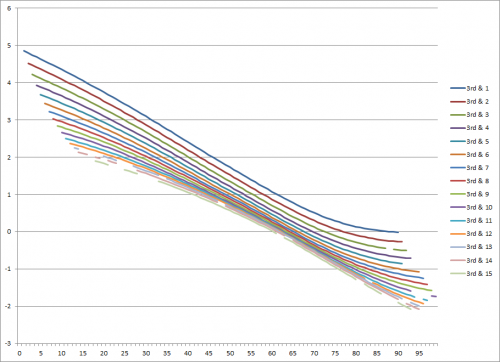
The vertical axis is the EP values and the horizontal axis is the yardline. As you can see, the closer to the endzone you get, the more points you’re likely to score…pretty obvious. What the chart allows us to do though is place a number on just how big the difference is between different yardlines. 1st and Goal from the 1 is worth about 5.5 points, while 1st and 10 from your own 1-yard line is actually worth negative points (about -0.5)–it’s more likely that your opponent will score before you do. Let’s check out 2nd and 3rd down now. I’ve included everything from 1 yard to go through 15 yards to go. As you’ll see, each line is essentially the same shape, just a little lower on the chart.
2nd down:
And 3rd down:
Caveats
There are a few caveats to point out. First of all, this data encompasses teams of widely varying caliber–from national champion Auburn through 0-11 FCS school Valparaiso. For many purposes, this is fine. Auburn is clearly much better than Valpo, but we’ll want to use EP to tell us just that. It provides a baseline for an average team, and we can see how far above or below an average team they each performed. In addition, the EP model won’t change much by removing better or worse teams–if you think about it, Auburn is way better at offense AND defense than Valpo. Since Auburn’s offensive and defensive drives are both included, the effect of removing them will more or less cancel out. Putting all that aside, there are analyses where we’ll want to know the EP of the team in question. In time, I hope to be able to create custom EP models for specific teams or groups of teams. In many instances, this will improve our analysis.
Other caveats: there are data errors, but overall they should be minimal and have a very small impact. I only used one year of data, but that includes over 1,000 games which is plenty (that’s about 4 seasons worth of NFL games). EP does not take into account weather, play calling, home field, or whether a team is a great running (better at short yardage) or passing (better at long yardage) team. Again, it’s just a baseline, it is not meant to be 100% exact.
Conclusion
Tomorrow the season starts. Coaches will be making hundreds of decisions each game: whether or not to punt, to run, to pass, to call timeout, to go for two, who to play, what defense to call. Expected Points is one tool we can use to separate the smart decisions from the tough decisions from the dumb decisions. Until then, enjoy the games. Football is back.


Thanks for the email, and per your request, I’ll keep my comments here.
Quickly, to catch up any other readers, I’m using Monte’s EP for college football to estimate EP Added (or EPA) for individual players (well, as best we can with the obvious caveats of teammate impact).
The only problem I’m having with individualizing EP is that I’m not sure what to do with failed 3rd down plays. For example, let’s say it’s 3rd and 12 from roughly 80 yards out. EP is -1 or so. If the QB throws an incomplete pass, what is the new EP at 4/12, 80? Is it now zero? If so, that values the incomplete pass at +1.0, which seems incorrect.
If I could figure this out, I could start doing EPA for the 2012 season, which could be very interesting.
Any ideas?
Brent, 4th down itself will have it’s own value. 4th and 12 from your own 20 will definitely be worse than 3rd and 12 from your own 20. 4th down is a little tricky but I do have some estimates. I’ll try to post them soon. The incomplete pass will definitely have a (slightly) negative EPA.
That’s awesome. Once again, fantastic work putting all this together.
Do you have all the averages in a spreadsheet somewhere? Just curious if there are more precise values to work with than what the graphs offer.
Really looking forward to this data. I think your research could mean big things for college football statistics.
Obviously, I’m getting pretty excited for college football season!
Hello,
As per methodology using “LOESS Regression” I was wondering how you were able to smooth across 3 dimensions? In my own study I am not able to make the separate 2nd down and distance lines relate to each other. Any thing you could offer would be extremely helpful. Thank you kindly.
-Matt
I used the LOESS package built into R.
Would you happen to have a table with all your data? Much appreciated.