 When evaluating a team’s offense, two of the most important statistics are Yards Per Rush and Yards Per Pass. Put simply, you want to know how many yards, on average, calling a rushing or a passing play will net you. These statistics have proven to be good indicators of how many points an offense will score.
Distribution of Yards Gained on Rush/Pass Plays
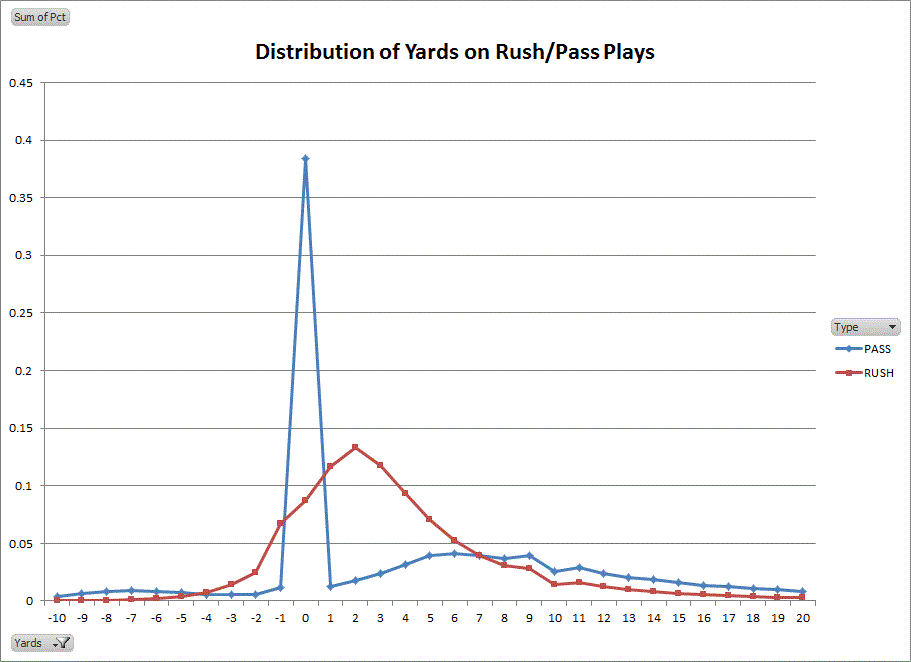
While maximizing the number of yards per play is usually a good proxy, the ultimate goal of a drive is to maximize points*. (NOTE: Points here does not necessarily mean the points you score on that drive, but the net point expectancy, including field position when you don’t score.) One factor that could affect drive success over and above yards per play is the distribution of those yards. Let’s look at a graph to illustrate my point.
*Actually, it is to maximize the likelihood of a win, but I’m going to simplify that to points for now, which is very close to win maximization, especially early in games.
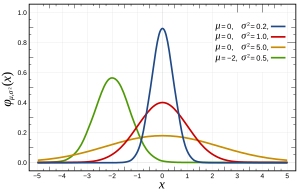
The red line is for rushing plays and indicates how often a rush nets that specific yardage. You can see that the most likely outcome is a 2-yard gain, with the line falling off in either direction (though a steeper decline towards negative yardage). Rushing plays somewhat resemble a normal distribution (also called Gaussian). Passing plays are much different. While completions have a similar distribution to rush plays–just moved forward a little to where the peak is around 6 yards–the most likely outcome of pass plays is actually 0 yards: an incompletion. This creates a bimodal distribution, which you can see above. There are actually two modes, or bumps, with one at 0 and one at around 6 yards. When you account for sacks (which are classified as passing plays), you actually get a tri-modal distribution, and the above graph shows this as well with a small bump centered around -7 yards.
Drive Simulator
There are two reasons that average yards is not the sole factor in drive success. Most important is the first down. To extend a drive, the offense needs to continually gain 10 yards in 3 (or 4) downs. Secondly, it doesn’t matter how many plays it takes you to complete your drive. An 80-yard bomb for a TD is no better than a 20-play, 80-yard drive: both result in 6 points despite one averaging 80 yards per play and the other just 4.
To test how different distributions affect scoring on a drive, I have created a Drive Simulator. The simulator will allow us to feed in a distribution (or distributions) and simulate thousands of drives before spitting out the average number of points scored and other peripherals such as number of touchdowns, field goals, yards, and turnovers.
Let’s start with just rushing plays. We know it’s possible for a distribution with a lower average to lead to more points. A quick example would be a team that rushes for exactly 4 yards every time. This team would obviously score a TD on every drive, for 7.0 points per drive (as of now, the simulator assumes 100% accuracy on XPs). We can easily construct a team with a higher yards per rush, but a lower points per drive. Say, a team that averages 5 yards per carry, but rushes for 0 yards half the time and 10 yards the other half. This team would obviously not score a TD every time, and plugging it into the drive simulator confirms that, telling us that this team would score 2.8 points per drive.
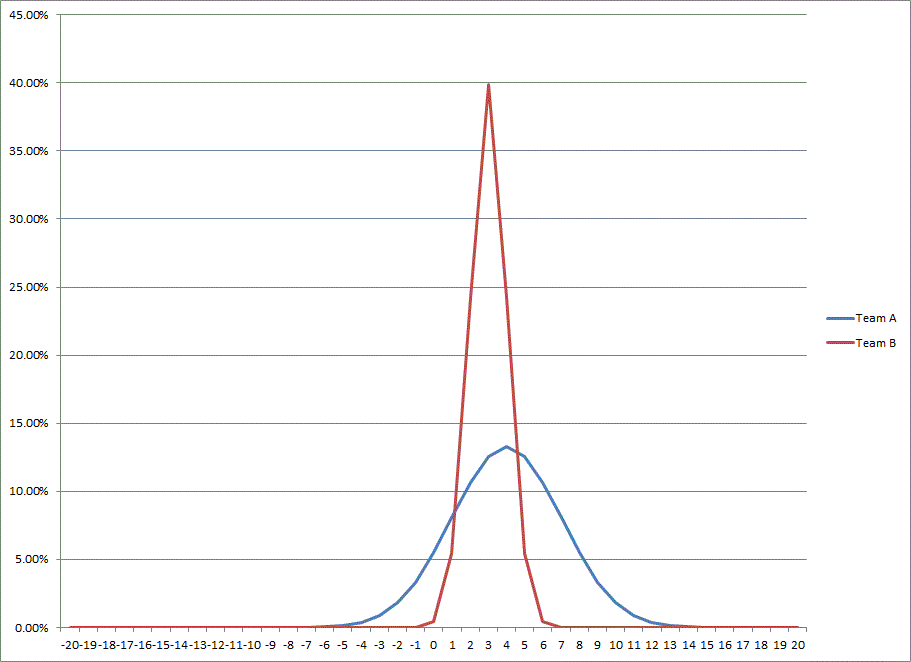
Now that we know distribution is important, let’s do a few simple tests to see how different distributions affect drive success. First, I’ll compare Team A that averages 4.0 yards per carry with a standard deviation of 3 yards (this means that 2/3 of all their plays will gain between 1 and 7 yards) with Team B that averages 3.0 yards per carry but a much tighter distribution of just 1 yard SD (2/3 of plays between 2 and 4 yards). Team A will average more yards and have more big plays but also more negative plays. Team B will almost always gain around 3 yards. Here’s what that looks like:
In this example, Team A outperforms Team B scoring 1.23 points per drive to just 0.15 for Team B. Let’s add a full yard to each team, so that Team A now averages 5 yards per carry and Team B, 4 yards per carry. What happens? Team A nearly triples their scoring average, to 3.51 points per drive. However, Team B explodes for 5.30 points per drive. The yard increase moves Team B into a sweet spot that allows them to convert 1st downs at an extremely high percentage.
Conclusion
While that wasn’t the most exciting analysis, it does prove that the distribution of a team’s yards can have a large effect on their success. The Drive Simulator will be a useful tool going forward that will help answer some interesting questions about play calling. Soon, I’ll look at pass distributions, which are much more intricate than the rush distributions discussed in this article. More importantly, we can learn many more useful things. On a running play, for the most part, there is little the team can control about it’s distribution. But in passing, there are multiple decisions: 3-, 5-, or 7- step drop? Hit the checkdown early or wait for something to open up downfield? Air it out hoping for the big play or dink and dunk to string together 1st downs? All of these decisions will change the distribution of yards, by affecting completion percentage, yards per completion, sacks, and interceptions. In Part 2, I’ll explore many of these questions and see if the drive simulator can help us arrive at some answers.


Nice article. I’ve wanted to do something like the drive simulator for a while. I have one question though-what does your drive simulator do with 4th downs? It would be interesting (especially once passing is added so the simulator is more realistic) to see the difference between punting unless in FG range vs going for it in situations that Brian Burke’s 4th down series calls for.
Good question. For my first pass, I wanted something simple and realistic. I looked at distance to go (4th and 1, 4th and 2, etc.) and then grouped field position into groups of 10 yards. For each of those combinations, I empirically derive the percentage of times teams punted, kicked a FG, or went for it.
The way I set it up, this is just another factor that can be changed. So we can hold rushing and passing constant and have a team go for every 4th down or use Brian Burke’s suggestions or whatever else you’d want to test. It’s really a question of what you want to test, and then using the appropriate 4th down decisions algorithm.
Its a nice base to use, but the statement that an 80 yard pass is the same as a 8 min drive isn’t true. Long drives keep defenses on the field longer and defenses, especially in the trenches, tend to tire faster because they are larger and have to move more. Watch film of a defense that has been on the field most of the game in the 4th quarter and you will see guys chugging.
Dave, I was speaking very generally. Certainly, depending on time and situation there will be times when the two drives are not exactly similar. If it’s early, you may be right that tiring the defense out is better. If it’s late and you’re trailing, clearly scoring fast is better.
The point in my example was simply that on that drive, the result is the same: a TD. However, the efficiency stats will look very different, with one drive going for 80 yards a play and the other for 4. (In fact, in your example, it just makes the 4-yards-per-play drive even more desirable, further proving my point.)
Great work! Excellent analytical handling of the issue.