With the tournament under way, I wanted to post my NCAA Tournament predictions. Things didn’t go so well for me with my Conference Tournament predictions, so hopefully the big dance will provide some sort of redemption.
I really hate the traditional bracket with normal scoring rules, as the best bracket ends up just being pretty much chalk and, well, what’s the fun in that? However, I’m guessing most people want to see my “bracket” so I’ll provide it. It’s really unexciting: only two double-digit seeds are favored by my system in the first round–11-seeds St. Mary’s and Minnesota–and there are only a couple more mild upsets along the way.
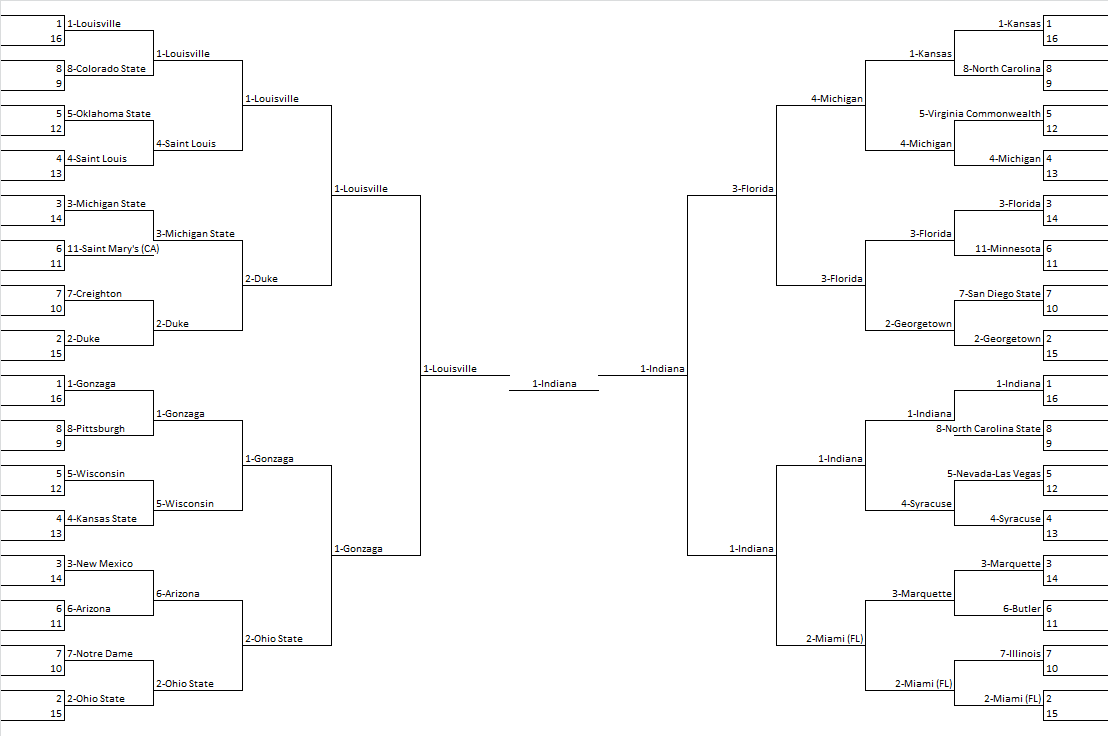
There’s a lot of information in predictive systems like mine, but this bracket shows virtually none of it. A better way to display all of the information is with advancement odds, like I did for conference tournaments. Here is the likelihood of each team advancing to each round of the tournament.
| Rg | Sd | Team | Rtg | Rk | Rd of 32 | Sweet 16 | Elite 8 | Final 4 | Champ Game | Champ |
|---|---|---|---|---|---|---|---|---|---|---|
| 3 | 1 | Indiana | 98.0 | 1 | 98.2 | 87.6 | 70.7 | 59.4 | 39.6 | 26.4 |
| 1 | 1 | Louisville | 97.5 | 2 | 99.3 | 76.2 | 61.1 | 45.1 | 28.5 | 15.7 |
| 2 | 3 | Florida | 97.4 | 3 | 96.7 | 71.0 | 55.7 | 36.6 | 20.8 | 12.5 |
| 4 | 1 | Gonzaga | 96.9 | 4 | 98.5 | 62.3 | 41.2 | 26.7 | 15.6 | 7.8 |
| 2 | 4 | Michigan | 96.7 | 5 | 93.0 | 71.8 | 50.7 | 28.0 | 14.4 | 7.8 |
| 4 | 2 | Ohio State | 96.1 | 6 | 91.6 | 68.4 | 46.8 | 24.0 | 12.8 | 5.8 |
| 4 | 5 | Wisconsin | 96.1 | 7 | 73.9 | 60.8 | 29.5 | 17.6 | 9.3 | 4.2 |
| 1 | 2 | Duke | 94.5 | 9 | 94.0 | 57.9 | 34.6 | 14.8 | 6.5 | 2.4 |
| 4 | 8 | Pittsburgh | 95.8 | 8 | 71.9 | 31.1 | 18.6 | 10.7 | 5.5 | 2.4 |
| 2 | 1 | Kansas | 94.0 | 11 | 93.6 | 66.3 | 28.8 | 11.9 | 4.6 | 1.8 |
| 3 | 4 | Syracuse | 93.6 | 13 | 94.6 | 63.4 | 18.2 | 11.2 | 4.3 | 1.6 |
| 4 | 6 | Arizona | 93.8 | 12 | 75.0 | 48.5 | 22.6 | 8.9 | 3.8 | 1.3 |
| 1 | 3 | Michigan State | 93.6 | 14 | 75.2 | 44.7 | 22.8 | 9.0 | 3.6 | 1.2 |
| 3 | 2 | Miami (FL) | 92.3 | 19 | 90.9 | 57.2 | 35.3 | 10.2 | 3.5 | 1.2 |
| 2 | 11 | Minnesota | 94.4 | 10 | 73.6 | 24.4 | 15.3 | 7.3 | 2.9 | 1.2 |
| 2 | 2 | Georgetown | 92.3 | 18 | 92.7 | 56.1 | 17.2 | 6.8 | 2.3 | 0.8 |
| 3 | 3 | Marquette | 91.5 | 21 | 76.6 | 52.5 | 27.8 | 7.5 | 2.4 | 0.7 |
| 1 | 4 | Saint Louis | 92.2 | 20 | 77.0 | 45.4 | 13.6 | 6.4 | 2.3 | 0.7 |
| 1 | 11 | Saint Mary's (CA) | 92.6 | 16 | 70.0 | 36.9 | 17.5 | 6.3 | 2.3 | 0.7 |
| 1 | 7 | Creighton | 92.5 | 17 | 58.9 | 26.4 | 13.6 | 4.9 | 1.8 | 0.5 |
| 1 | 8 | Colorado State | 92.8 | 15 | 55.5 | 14.2 | 8.2 | 4.0 | 1.5 | 0.5 |
| 4 | 3 | New Mexico | 91.1 | 24 | 82.0 | 38.5 | 14.5 | 4.5 | 1.5 | 0.4 |
| 2 | 5 | Virginia Commonwealth | 91.3 | 22 | 72.2 | 22.2 | 10.6 | 3.5 | 1.1 | 0.3 |
| 3 | 7 | Illinois | 89.2 | 34 | 60.4 | 27.3 | 14.5 | 3.3 | 0.9 | 0.2 |
| 1 | 5 | Oklahoma State | 90.3 | 29 | 56.6 | 28.5 | 7.2 | 2.9 | 0.9 | 0.2 |
| 4 | 7 | Notre Dame | 90.6 | 26 | 59.1 | 19.2 | 9.0 | 2.7 | 0.9 | 0.2 |
| 2 | 7 | San Diego State | 90.6 | 27 | 65.3 | 31.3 | 8.3 | 2.9 | 0.8 | 0.2 |
| 3 | 5 | Nevada-Las Vegas | 90.0 | 30 | 69.3 | 28.4 | 5.9 | 2.9 | 0.8 | 0.2 |
| 1 | 9 | Missouri | 91.2 | 23 | 44.5 | 9.7 | 5.1 | 2.2 | 0.7 | 0.2 |
| 1 | 10 | Cincinnati | 89.6 | 32 | 41.1 | 15.1 | 6.5 | 1.9 | 0.5 | 0.1 |
| 3 | 6 | Butler | 85.8 | 42 | 65.6 | 28.1 | 11.0 | 2.0 | 0.4 | 0.1 |
| 4 | 12 | Mississippi | 89.6 | 33 | 26.1 | 16.2 | 4.1 | 1.5 | 0.4 | 0.1 |
| 1 | 12 | Oregon | 87.7 | 35 | 43.4 | 19.2 | 4.0 | 1.4 | 0.3 | 0.1 |
| 2 | 8 | North Carolina | 87.6 | 36 | 55.1 | 19.1 | 5.2 | 1.3 | 0.3 | 0.1 |
| 3 | 8 | North Carolina State | 87.1 | 38 | 56.9 | 7.6 | 2.8 | 1.2 | 0.3 | 0.1 |
| 4 | 9 | Wichita State | 89.9 | 31 | 28.1 | 6.6 | 2.6 | 0.9 | 0.3 | 0.1 |
| 3 | 10 | Colorado | 84.4 | 45 | 39.6 | 14.2 | 6.1 | 1.0 | 0.2 | 0.0 |
| 4 | 10 | Iowa State | 87.0 | 39 | 40.9 | 10.5 | 4.0 | 0.9 | 0.2 | 0.0 |
| 4 | 4 | Kansas State | 85.6 | 43 | 57.5 | 14.4 | 2.8 | 0.8 | 0.2 | 0.0 |
| 2 | 9 | Villanova | 85.2 | 44 | 44.9 | 13.7 | 3.2 | 0.7 | 0.1 | 0.0 |
| 1 | 6 | Memphis | 84.4 | 46 | 30.0 | 10.0 | 2.8 | 0.6 | 0.1 | 0.0 |
| 3 | 9 | Temple | 83.6 | 52 | 43.1 | 4.6 | 1.4 | 0.5 | 0.1 | 0.0 |
| 4 | 11 | Belmont | 83.5 | 53 | 25.0 | 9.9 | 2.4 | 0.4 | 0.1 | 0.0 |
| 1 | 14 | Valparaiso | 82.8 | 56 | 24.8 | 8.3 | 2.2 | 0.4 | 0.1 | 0.0 |
| 2 | 10 | Oklahoma | 83.7 | 50 | 34.7 | 11.8 | 1.9 | 0.4 | 0.1 | 0.0 |
| 2 | 6 | UCLA | 85.9 | 41 | 26.4 | 4.3 | 1.6 | 0.4 | 0.1 | 0.0 |
| 4 | 13 | La Salle | 81.5 | 59 | 42.5 | 8.6 | 1.3 | 0.3 | 0.1 | 0.0 |
| 3 | 11 | Bucknell | 75.9 | 80 | 34.4 | 9.9 | 2.5 | 0.3 | 0.0 | 0.0 |
| 3 | 14 | Davidson | 76.6 | 78 | 23.4 | 9.5 | 2.5 | 0.3 | 0.0 | 0.0 |
| 3 | 12 | California | 79.9 | 68 | 30.7 | 7.6 | 0.9 | 0.3 | 0.0 | 0.0 |
| 2 | 12 | Akron | 80.2 | 67 | 27.8 | 4.4 | 1.2 | 0.2 | 0.0 | 0.0 |
| 1 | 13 | New Mexico State | 78.1 | 73 | 23.0 | 6.9 | 0.8 | 0.2 | 0.0 | 0.0 |
| 4 | 14 | Harvard | 69.3 | 99 | 18.0 | 3.1 | 0.4 | 0.0 | 0.0 | 0.0 |
| 4 | 15 | Iona | 69.4 | 98 | 8.4 | 1.8 | 0.3 | 0.0 | 0.0 | 0.0 |
| 2 | 13 | South Dakota State | 68.5 | 100 | 7.0 | 1.5 | 0.3 | 0.0 | 0.0 | 0.0 |
| 3 | 15 | Pacific | 54.4 | 143 | 9.1 | 1.3 | 0.2 | 0.0 | 0.0 | 0.0 |
| 2 | 16 | Western Kentucky | 51.8 | 155 | 6.4 | 0.9 | 0.1 | 0.0 | 0.0 | 0.0 |
| 1 | 15 | Albany (NY) | 52.3 | 153 | 6.0 | 0.6 | 0.1 | 0.0 | 0.0 | 0.0 |
| 2 | 15 | Florida Gulf Coast | 48.5 | 169 | 7.3 | 0.8 | 0.0 | 0.0 | 0.0 | 0.0 |
| 3 | 13 | Montana | 45.3 | 184 | 5.4 | 0.6 | 0.0 | 0.0 | 0.0 | 0.0 |
| 2 | 14 | Northwestern State | 56.1 | 140 | 3.3 | 0.3 | 0.0 | 0.0 | 0.0 | 0.0 |
| 3 | 16 | James Madison | 48.3 | 171 | 1.8 | 0.3 | 0.0 | 0.0 | 0.0 | 0.0 |
| 4 | 16 | Southern | 32.2 | 231 | 1.5 | 0.0 | 0.0 | 0.0 | 0.0 | 0.0 |
| 1 | 16 | North Carolina A&T | 21.8 | 273 | 0.7 | 0.0 | 0.0 | 0.0 | 0.0 | 0.0 |
The table is fully searchable, sortable, and filterable. I added in the region and seed so you can sort and look at best/worst teams by seed and region.
For now, it’s time to finally enjoy the games.